Using Airplane Transponder Data to Characterize Antenna Performance
Hi All,


Recently I obtained some low-noise amplifiers in order to better receive NOAA GOES satellites. A low-noise amplifier however is no good without a decent antenna. Most often people use these 2.4 GHz wifi antennas modified to operate at the GOES downlink frequency. This typically gives very good results but it's pretty challenging to DIY a satellite dish. An alternative to satellite dish type antennas is the highly directional yagi-uda antenna. Yagi-uda antennas are pretty (seemingly) simple to build so one night I made a first pass at throwing one together. Alas the satellite signal still did not appear (probably due to my poor assembly). Instead of scrapping the inadequate antenna I decided to try and figure out if adding the passive elements actually did anything to the directionality of the yagi-uda antenna versus a regular dipole antenna.
To do this without some sort of signal source is typically impossible and so people resort to modelling programs that calculate the gain for a particular antenna design using field equations and finite element or other discrete numerical methods. This is not useful in my case since the issue isn't the performance of an ideal yagi-uda antenna but of the imperfect one that I made. Since I'm not interested in ideal performance I'd need a signal source. In a previous post I wrote about receiving airplane position data from aircraft transponders. This seemed to be a perfect signal source since being in San Diego there are several nearby airports and plenty of air traffic to sample. So I started collecting air traffic (adsb) signals for both the dipole antenna and the yagi antenna in approximately the same position. Something to note is that the data was not collected simultaneously which means I had to rely on collecting as many samples as possible and assume that flight density and path are on average uniform.

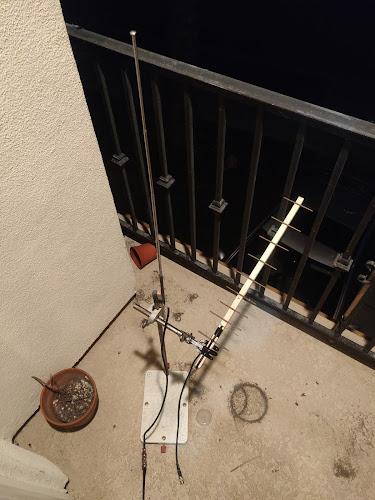
Here's a picture of the setup, you can see the not-so-good yagi-uda antenna has exposed shielding and core from RG-58 coax cable because soldering the connections to the thick copper wire used for the other elements was quite difficult with my current soldering setup.
After collecting data for about 24 hours on each antenna I had my two datasets and so it was on to Mathematica to do the processing.
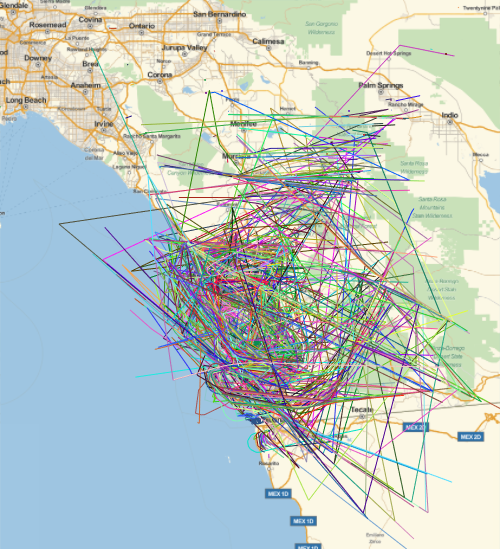
The three dimensional position data was converted to a two dimensional position by discarding the altitude, then the data was binned across the latitudinal and longitudinal directions producing the following plots.

Now the problem with this data is that its too localized, there's not enough data to uniformly sample the space that I'm interested in (too much empty space basically). To get around this I carried out a convolution of the data with a gaussian kernel producing the following plots.

Now that looks better, much less empty space.
The problem now though is that to compare these two data sets would not account for the possibility that more airplanes passed over one antenna than the other. To get around this we normalize each data set by dividing each point by the maximum. This makes the peak of the data in both sets equal to 1 and will allow us to compare the shapes of the distributions more accurately. Remember we're not interested in the "z" direction gain (altitude) just the "x" and "y" directions, this is why I think this normalization is valid. By then subtracting the dipole data from the yagi-uda data we get the following difference plot.

The plot title says it but in case it's not clear the orange represents a place of higher yagi-uda gain versus the dipole antenna, and blue represents less gain. I think it's clear from the plot that a significant directional gain is formed by the yagi-uda versus the dipole antenna.
Quite honestly I was surprised this worked so well. I'm continuously recording the flight data so hopefully I'll get a better sampling over the next few days. It's possible in principle to assign an uncertainty to every point in the difference plot based on the number of samples that were binned at that point but that's outside the scope of the present blog post.
I hope you are able to employ similar methodologies to assess your own antenna performance. This didn't really say anything about why I can't see the goes signal with my yagi-uda but it was a cool little project I think. It's worth mentioning a few things that could be improved. I wasn't using the yagi-uda or dipole antennas in the appropriate range. ie the discrepancy between the two antennas would become harder to detect as the signal source frequency starts deviating from the frequency that each antenna is tuned for. I would argue though that the normalization step accounts for some of this discrepancy. Another is that there's a house on one side of the dipole/yagi-uda setup but since the positions of each antenna are so close this large obstruction should be cancelled out when taking the difference between the two data sets.
Thanks for reading!
Alex

Comments
Post a Comment