Tracking Local Airplanes with an SDR and dump1090
Hi,
I spent the last day or so collecting data and visualizing it with Mathematica.
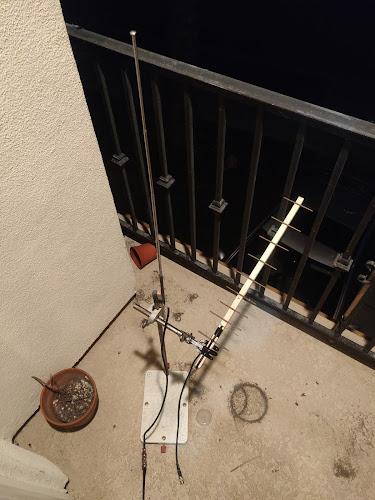
The data was collected using a nooelec SDR and the open source software dump1090. I had initially thought this wasn't possible because this particular model of SDR has a dead spot near 1090 MHz where the signal is received. Nonetheless, the SDR is capable of receiving aircraft transponder data when fitted with a pcb digital antenna.
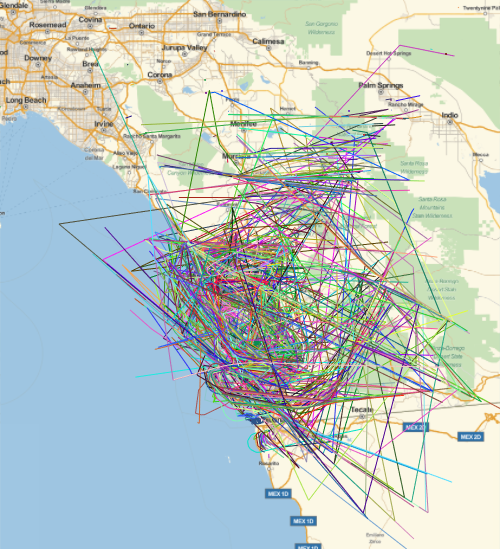
Since San Diego is home to several airports I expected a lot of commercial air traffic, however to my surprise I was able to receive signals all the way up from Palm Springs. Over the course of the collection period I accumulated ~139 MB of data.
Before we get to how I visualized the results lets look at the software and methods utilized to collect the data:
dump1090 can be found here: https://github.com/antirez/dump1090
by executing
$ ./dump1090 --aggressive --interactive --net --net-http-port 10900 --net-sbs-port 30003
we start a server that gives real time visualization at localhost:1090 and data output at localhost:30003
We can log the data output by using netcat. It should be installed by default on most linux distributions but if it isn't a quick search will tell you how to install it.
By executing
$ nc 127.0.0.1 30003 >> file.csv
we log the sbs output to a csv file. We can monitor it in real time with
$ tail -f file.csv
There are a lot of ways to approach visualizations of the data and so I'm foregoing the actual code. As always if you've got specific questions regarding this, comment below. The following images were generated in Mathematica 12.0


I spent the last day or so collecting data and visualizing it with Mathematica.
The data was collected using a nooelec SDR and the open source software dump1090. I had initially thought this wasn't possible because this particular model of SDR has a dead spot near 1090 MHz where the signal is received. Nonetheless, the SDR is capable of receiving aircraft transponder data when fitted with a pcb digital antenna.
Since San Diego is home to several airports I expected a lot of commercial air traffic, however to my surprise I was able to receive signals all the way up from Palm Springs. Over the course of the collection period I accumulated ~139 MB of data.
Before we get to how I visualized the results lets look at the software and methods utilized to collect the data:
dump1090 can be found here: https://github.com/antirez/dump1090
by executing
$ ./dump1090 --aggressive --interactive --net --net-http-port 10900 --net-sbs-port 30003
we start a server that gives real time visualization at localhost:1090 and data output at localhost:30003
We can log the data output by using netcat. It should be installed by default on most linux distributions but if it isn't a quick search will tell you how to install it.
By executing
$ nc 127.0.0.1 30003 >> file.csv
we log the sbs output to a csv file. We can monitor it in real time with
$ tail -f file.csv
There are a lot of ways to approach visualizations of the data and so I'm foregoing the actual code. As always if you've got specific questions regarding this, comment below. The following images were generated in Mathematica 12.0
This image shows all of the paths recorded, the sharp turns seen are likely due to insufficient points and so the interpolated path shows very sharp turns, these are not realistic.
This image shows a sample of the above paths, its easier to make out the paths. The colors are randomly selected so it's not necessarily true that two paths of the same color represent the same aircraft, this is a bit of an issue but I think you get the point.
This is a side view of the above paths.
This is a 3d plot of all of the paths collected.

This comment has been removed by the author.
ReplyDeleteYour comment was:
DeleteThey've been saying that curved flight paths are just a government cover up of the flat earth. Here, we have a local Caltech genius showing us the truth. Flat earth confirmed!
https://www.netflix.com/title/81015076?s=a&trkid=13747225&t=cp
To which I reply, have you even watched the documentary? The ring laser gyroscope measurement clearly supports the globe earth. At least have the integrity to stand by your comments.
Lol Alex, that was sarcasm.
DeleteI thought it would be obvious. Ty for the giggles.
Sincerely,
A friend